![]() Estimating Edge’s team of experienced construction professionals and software engineers have developed the industry’s smartest takeoff and estimating software solutions for competitive estimates.
Estimating Edge’s team of experienced construction professionals and software engineers have developed the industry’s smartest takeoff and estimating software solutions for competitive estimates.
Don’t just estimate faster. Estimate better.®
- /
- /
- /
Navigating the Admin Portal
How to navigate the Administration Portal for EDGE On Site users.
- Go to the Administration Portal, which can be accessed in two ways.
-
- Go to admin.edgeestimator.com.
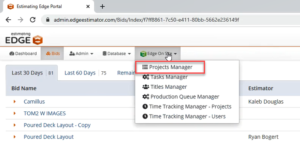
- The other option is on The EDGE, click on the gear icon in the top right-hand corner, which when hovered over shows “Admin Portal.” Taking the user directly to the Administration Portal.
- Go to admin.edgeestimator.com.
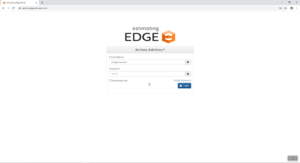
Once in the Portal,
- Log-in by entering your username and password.
Note: Your company may need to assign you to the Admin Portal.
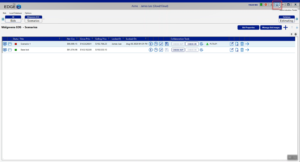
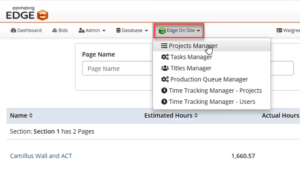
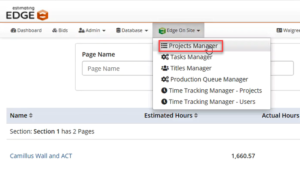
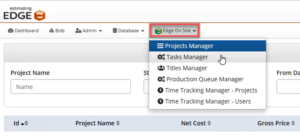
- Once logged in, the bid screen will appear. Click on the EDGE On Site drop-down.
Note: The EDGE On Site drop-down will become available when your company purchases EDGE On Site.
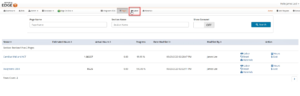
- Click on Project Manager.
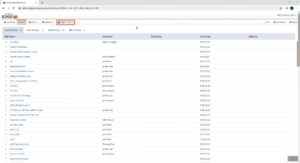
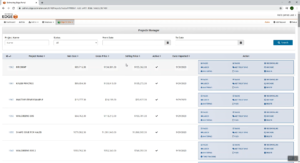
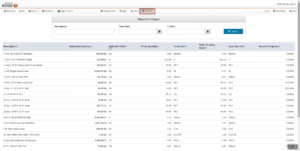
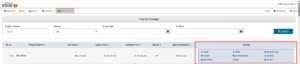
- A list of all the projects that have been activated for EDGE On Site, starting with the most recently activated at the top.
Note: To learn how to activate an EDGE estimate for EDGE On Site, check out Activating a Bid for EDGE On Site.
Note: The user can search by project name, status (active or archived), and date.
-
- Searching by the project name allows the user to find the project easily.
- Archived is commonly used when a project is completely finished so all the production and hours have been used up equaling 100% completion. This is used to take the project out of the cloud on the EDGE On Site application without deleting all of the historical data. Once a project has been archived, you can change the project back to active if need be.
- Searching by date range will filter by the project date imported.
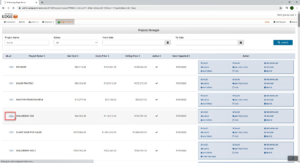
- Once you have found the project you would like to see inside of, click the project ID that is a hyperlink.
Note: The user can see the gross price and selling price.
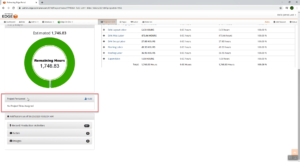
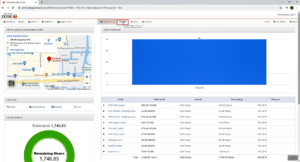
Project Overview Screen
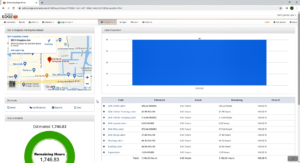
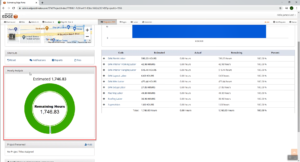
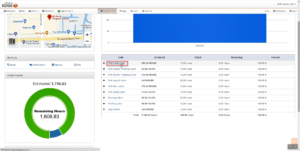
- The Project Overview screen will appear.
Note: If you’re familiar with the iPad then some of this data and layout may look familiar to you.
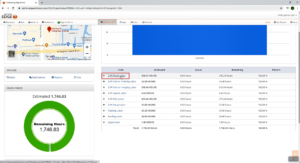
-
- An interactive map showing the address of the project and where it is located on the GPS system.

- Daily production graph generating a bar for every day that production has been tracked.
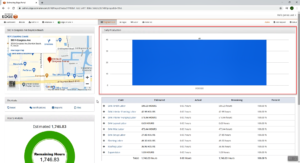
- Below there is a list of all the cost codes that came over from The EDGE. The EDGE is bringing over how many estimated hours were assigned to them as your input hours will update the actual column, and based on the information and estimate an actual will tell you how much you have remaining. The percentages are representing completion. The user can click the “+” to get a better look at all the different units of measurement and quantity of this specific code.
Note: These can be altered based on the code used internally in your organization (Phase codes, cost codes, user codes, or account codes).
Note: The percentage is quantity-based that goes for the portal and the iPad.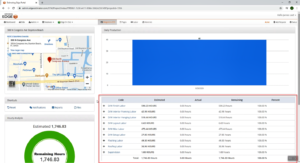
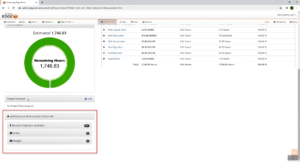
- The shortcut section gives the user the ability to reset, notifications manager, reports, and files manager.

- An interactive map showing the address of the project and where it is located on the GPS system.
-
-
- Reset button: will completely reset the project wiping all actual hours and quantity. A total last resort, please do not commit that action without reaching out to us first; whatever the issue is with your project there may be other ways to solve it before wiping the entire thing.
- Notifications manager: will be a screen where you can set notifications to be sent to a phone or email when a project reaches a certain completion percentage, or you can also set it to get notifications when photos and notes are uploaded.
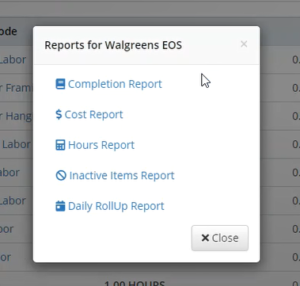
Note: This is not currently hooked up right now but will be available soon. - Reports: will give you a completion report, cost report, hours report, inactive items report, and daily roll-up report.
Note: Go through and figure out which of these gives you the best information.
-
-
-
-
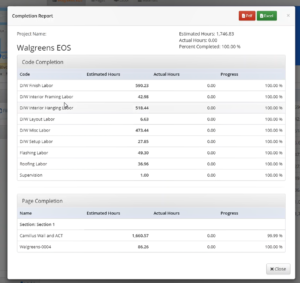
- A completion report: lists out your codes your estimated versus actual hours and give you a quantity completion so this information is very similar to what you’re seeing on this overview screen, but we’ll also break down your page completion. This is exportable by PDF or Excel.
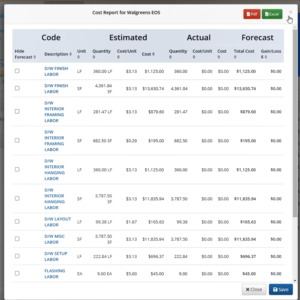
- A cost report: Give you a snapshot of what we call the labor screen. Looking at your codes and breaking it down by estimated and actual and comparing these two and giving you forecast information.
- Hours Report: similar to the cost report.
- An inactive items report: Please watch our video on the inactive items report to understand what that’s used for.
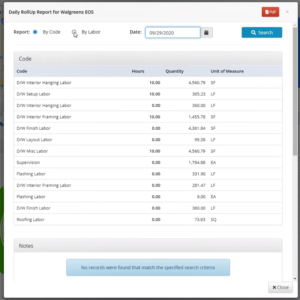
- A daily roll-up report: Automatically every night at 12am, midnight, a daily roll-up is stored for the previous day. Watch Daily Roll up report to learn more.
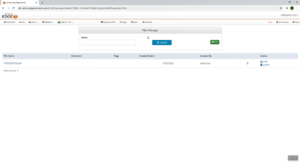
- Files manager: stores all files added from an iPad or you can add files here to be seen in an iPad, creates that two-way communication. If you want to add a file just click the add button and select the file from your computer and give it a comment, and click Add. You can always click on a document to view, edit, or delete. The user can upload Word, Excel, and most types of image files.
Note: Please reach out, if you have any specific questions about that.
- Files manager: stores all files added from an iPad or you can add files here to be seen in an iPad, creates that two-way communication. If you want to add a file just click the add button and select the file from your computer and give it a comment, and click Add. You can always click on a document to view, edit, or delete. The user can upload Word, Excel, and most types of image files.
- A completion report: lists out your codes your estimated versus actual hours and give you a quantity completion so this information is very similar to what you’re seeing on this overview screen, but we’ll also break down your page completion. This is exportable by PDF or Excel.
-
- Hourly analysis, showcasing your estimated hours with this green part of the pie chart and in the blue will show your actual hours.
- Project personnel section please reference our video for adding project personnel to understand what that does and how it works.
- Notification section so anytime a production is recorded, upload notes or images, an activity line item will appear. This is a reference to that activity was completed.
-
- Click a code will take you right out to the labor screen which is inside the selected code.
- Click on the project name, which will take you back to the overview screen.
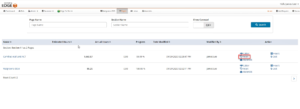
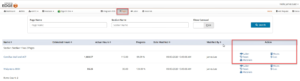
- Click on the pages. Pages will showcase the sections and pages inside of the selected project.
-
- Search by page name or by section name.
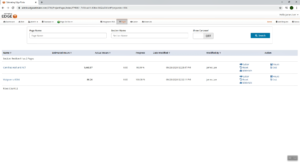
- Toggle to show a carousel that will just give a preview of the background image for each page inside this job. To remove, switch it back to off.
- See how many estimated hours were estimated per page.
- What our completion quantity progresses for that page.
- Who and when made the last modifications to this page.
- Search by page name or by section name.
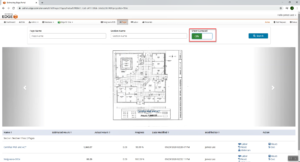
- Click on a page, which is going to pull up the background image that came over from the estimate and it’s going to pull up all the codes and conditions on this page along with the take off.
Note: This will look very similar to the tracking screen on the iPad if you’re familiar with it.
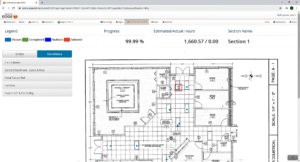
- Once the page appears, there is a legend at the top left, the state of the project’s progress and hours are broken down.
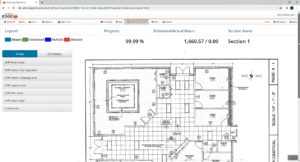
- Select a code or condition, the shapes associated with it will appear. This screen allows you to visually check the production that was tracked from the iPad.
Note: On the Overview Screen, you saw a quick percentage indicator now we’re getting a little deeper and looking at it visually.
Note: We can even click on the shape with the mouse and see the percentage of the total quantity.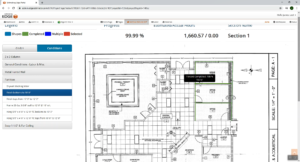
- Right-click directly on the screen. Add notes or files to be seen by field personnel.
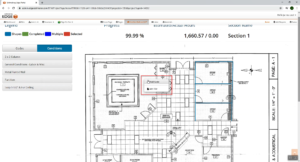
- Select a code or condition without expanding.
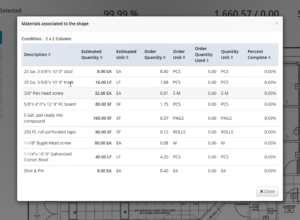
- Click on that shape, and you can get a breakdown of all the materials inside of that shape as production is tracked.
- The selected shapes material usage will be updated so you’ll be able to come in here and get insight as to how much material has been used for a shape.
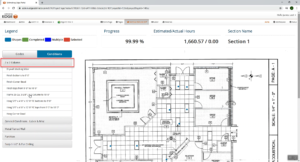
- Click on the pages arrow to jump back to the pages.
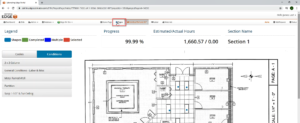
- The pages will appear, if we had more sections you would see another section below that said section two and would display all the pages inside of there.
-
- Page reset button, you want to follow the same concept, though please try not to reset any pages. Before reaching out to us there may be other ways to fix whatever the problem may be and a page reset will wipe all the quantity completion and ours from a page, and that’s irreversible from a user’s perspective. Please reach out to us before doing that.
- Page reset button, you want to follow the same concept, though please try not to reset any pages. Before reaching out to us there may be other ways to fix whatever the problem may be and a page reset will wipe all the quantity completion and ours from a page, and that’s irreversible from a user’s perspective. Please reach out to us before doing that.
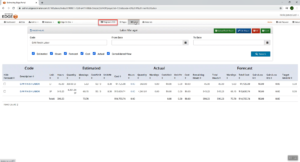
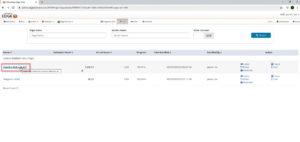
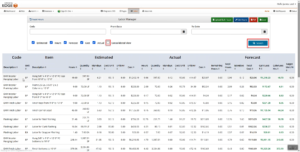
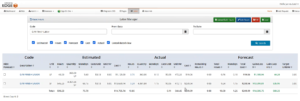
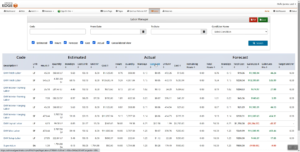
- Click on Labor. This is probably the most commonly used screen inside of the Administration Portal. It is where you’re going to view the most data and have the most functionality. This is called our Labor Manager.
- See a list of all the codes that come over from The EDGE estimator and again these can be user codes, phase codes, account codes, or whatever you prefer.
-
- Search by those codes here to filter the information.
- Search by a date range to see the quantities and hours that were uploaded on a certain day and get a cost breakdown of where the project was at a certain day and time.
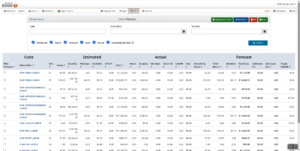
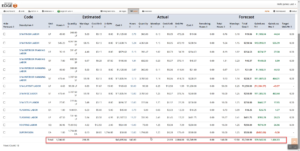
- Look at all the data we’re actually seeing here we’re looking at the code and all the different estimated data. We have estimated quantity, estimated hours, and the actual column, this is tracking all the production that is being uploaded from the iPad,
Example: The 360 lineal foot estimated we’ve actually marked all 360 of that lineal foot complete.
-
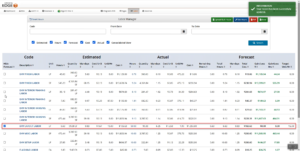
- Note: There are no hours in this project yet, but this screen is where you input all your hours, whether by spreadsheet or manual entry. Please see our video as to how to input hours inside of the navigation inside of the administration portal.
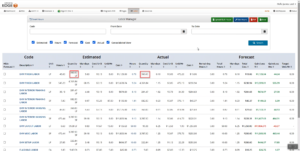
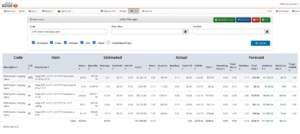
- Now we have some codes that actually have quantity and hours inside of them. We can take a look at what this forecast column is doing. It’s actually comparing estimate and actual data and giving a breakdown of how this code is going to finish, towards the end of the lifecycle of the project.
- Example: The interior hanging labor is estimated for a week of work at a production rate of about 8 units per hour, but actually working at a rate of about 414 square foot per hour and so quite obviously that’s going to have us finishing in the green which means we’re going to be about $11,607 ahead of our projection and we’ll finish about 464 hours ahead of our projection. Areas in the red, on the other hand, maybe in the red meaning that you have finished a certain dollar amount behind or a certain number of hours behind. This project has all of the quantity completed, so this target unit per hour column will be empty. If the project was currently still going on and you have not used all of your quantity yet you will see a target rate to work at to get back to par for the areas where you’re behind.
- A total row is located at the bottom to give you an idea of where your project is that cost-wise and where it’s forecasted to be.
- A total row is located at the bottom to give you an idea of where your project is that cost-wise and where it’s forecasted to be.
- Note: There are no hours in this project yet, but this screen is where you input all your hours, whether by spreadsheet or manual entry. Please see our video as to how to input hours inside of the navigation inside of the administration portal.
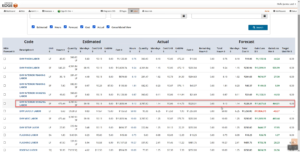
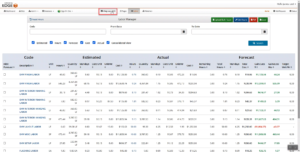
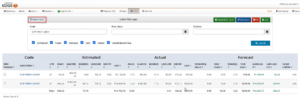
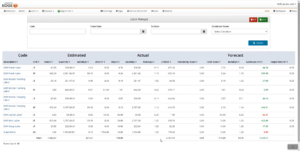
- Use the checkboxes at the top to remove the information from the sheet.
- Click Search. The page will refresh with the updated changes.
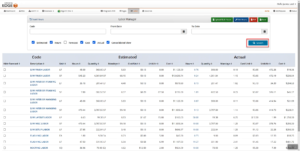
- Click the checkbox on the code level to hide the forecast. Notice, the layout labor my forecast information is blanked out.
Note: Most screens inside the Administration Portal all of our columns are sortable by that column.
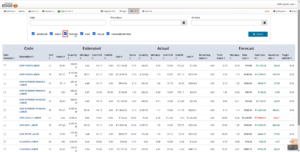
- If you uncheck consolidated view and then his search. Instead of looking at things by code actually looking at things by the labor item inside of a code. This is how you can really get micro level, and look at whether you’re ahead or behind for certain labor items and we can see what code that labor item is a part of.
- Check Consolidated View and click Search. To see a labor item instead of code, click on the hyperlink code.
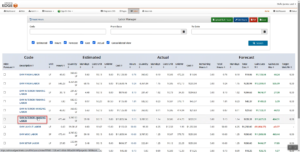
- Displays all the labor items for just that code.
- Click on the page name to get to the Overview screen.
- Clicked on one of the codes.
- The Labor Manager Screen will appear with the labor items for the selected code.
Note: Reset hours button that will effectively wipe all hours from the project. Please let us know before doing that there may be other ways to take care of whatever issues you might be experiencing the number and wiping all the hours in the project.
Reference Hyperlinks:
- Click on Pages. Now to reference some of these hyperlinks:
-
- Labor screen shortcut is going to produce the labor screen. All the data is going to be filtered to the specific page click.
Note: You’ll be able to tell that you’re in a page labor’s screen by seeing your pages back arrow here or by seeing this condition name sorter, and this will allow you to actually filter all this information to a certain condition inside of a certain page as we’ve just done here. Note: This is always exportable by PDF or Excel, and if we jump back to our labor screen for a moment, we see that this screen is also exportable by PDF and excel as well.
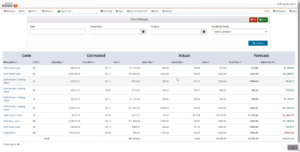
- Hours. We’re going to get a breakdown of the labor screen but really just focused on all the columns that revolve around hours
Note: See the condition sorted to indicate that you are on a page-level screen.
- Cost breakdown which will show you some information, as seen here that’s focused on cost per unit and cost per quantities. Gives you the columns that pertain to cost. Mess around with those views and decide which gives you the best insight.
- Material shows the materials inside of the page.
- Labor screen shortcut is going to produce the labor screen. All the data is going to be filtered to the specific page click.
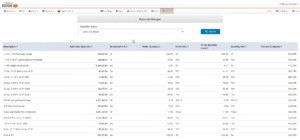
- Materials screen. A list of all the materials that came over from the estimate for this project and we’re going to see estimated quantity the order quantity and order units. See percentages of what materials have been used based on our production.
Note: Search by material description and filter by date to see the material that was used up to a certain day and time.
Note: If we jump back to our pages screen, we’ll see that we had a material link next to each page so we can generate that screen but specific to an individual page just like we did with labor.
Navigating the EDGE On Site Drop-Down:
Go back to the project manager by:
- Clicking the EDGE On Site drop-down.
- Click Project Manager.
- Action links:
- Pages will take you right to the pages screen we saw labor and materials will take you to their respective screens.
- Files manager.
- Notification screen here which again is not currently in use.
- Delete will give you the option to delete a project that’s another thing you want to reach out to us before you go ahead and archive.
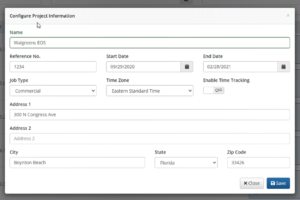
- Reconfigure when you first import a project into EDGE On Site, it’ll automatically pop up this configure project information screen where you input the project name. You can use the reference number to give it a bid number or to give it a number that you match up with spreadsheets for hours import. Start Date end date project address all basic information. If you are going to be using our time tracking application called EDGE On Time. This is where you would enable a project for time tracking purposes as well. Now, for projects that are enabled for time tracking, you will see a time tracking action link here for that project or all-time tracking information please see our separate knowledge base You can reconfigure anytime you want, changing any general information about the project. Hit reconfigure, and we’ll have the ability to change that information here if we’d like. Hit save and that will save that information for us.
- Tasks: please see our separate video on adding tasks to understand what value they have and how they work.
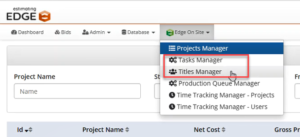
- Click EDGE On Site drop-down.
- Click Task Manager.
Note: This will be covered in the tasks video or titles manager is related to adding tasks and using project personnel. To understand the titles manager works please watch our videos on adding project personnel and creating tasks.
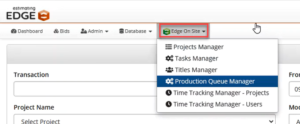
- Click EDGE On Site drop-down.
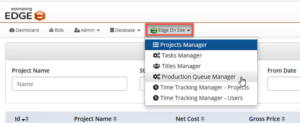
- Click production queue manager.
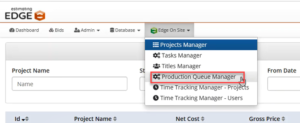
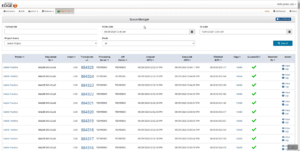
Note: This is also referenced in another video we have called uploading daily production and using the production queue. This will give you a line item that show you all of the uploads that have come from the iPad through the cloud into the portal so you can get a status of whether your uploads were successful, how long it took. And, you know, just to give you a preview of what the video covers the best way is when you do an upload to come here and see what the status of it is before you run reports so that you know that you have all your data.
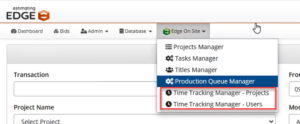
- Click EDGE On Site drop-down.
- Click time tracking. As you can guess those will be covered in our knowledge base items for time tracking.
You have seen everything in the Administration Portal that would be a value to you. Seeing all these screens and what they’re used for should make you feel more comfortable navigating. If you have any questions please feel free to reach out to us.